Gantt Chart view
Table of contents
Access the application
The Gantt chart is accessed through the Timelines application:
-
Go to the Timelines application through the topbar.
-
In the view-toggle bar, click Gantt (line-style icon).
Subjects available in the Gantt view
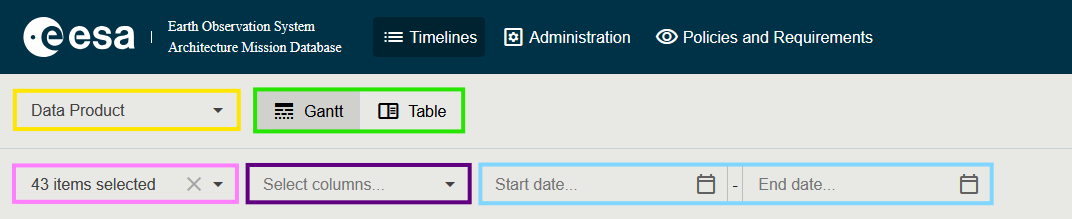
Use the Subject dropdown in the top-left of the toolbar to choose what to plot. Gantt is supported for:
- Mission
- Payload (Instrument)
- Data Product
- ECV (Essential Climate Variable)
- Space Program
- Project
- System
Each subject contributes a tailored set of columns and a configured set of bars (Mission Phases, Project Phases, instrument operational periods, …).
Toolbar reference
See Timelines → Toolbar for the full description of the toolbar buttons (subject dropdown, view toggle, Select columns, Add filter, Reset View, Colors, Export As…, Back to Benchmarking).
Colour-coding the bars
Click Colors in the toolbar to open the Colors dialog where the colour of each bar can be mapped to a property of the element (e.g. Status, Data Type, Categories). The mapping is saved per browser session.
Filtering and column selection
- The Select columns dropdown shows / hides Parameter Value columns in the underlying grid.
- The Add filter button opens an advanced filter panel; active filters appear as removable chips in the toolbar.
- The grid still supports per-column funnels for quick filtering and click-to-sort headers.
Export data
The Export As… split-button on the right of the toolbar exports the current selection. Two formats are supported:
Export to Excel
-
Apply any filter / column selection you want.
-
Click Export as Excel (or pick it from the split-button menu).
-
The Excel file is downloaded to your computer. The file contains both the data grid columns and a representation of the Gantt timeline.
Export to Microsoft Project
-
Apply any filter / column selection you want.
-
Open the split-button menu and choose Export as MS Project.
-
An XML file is downloaded.
-
Open Microsoft Project on your computer.
-
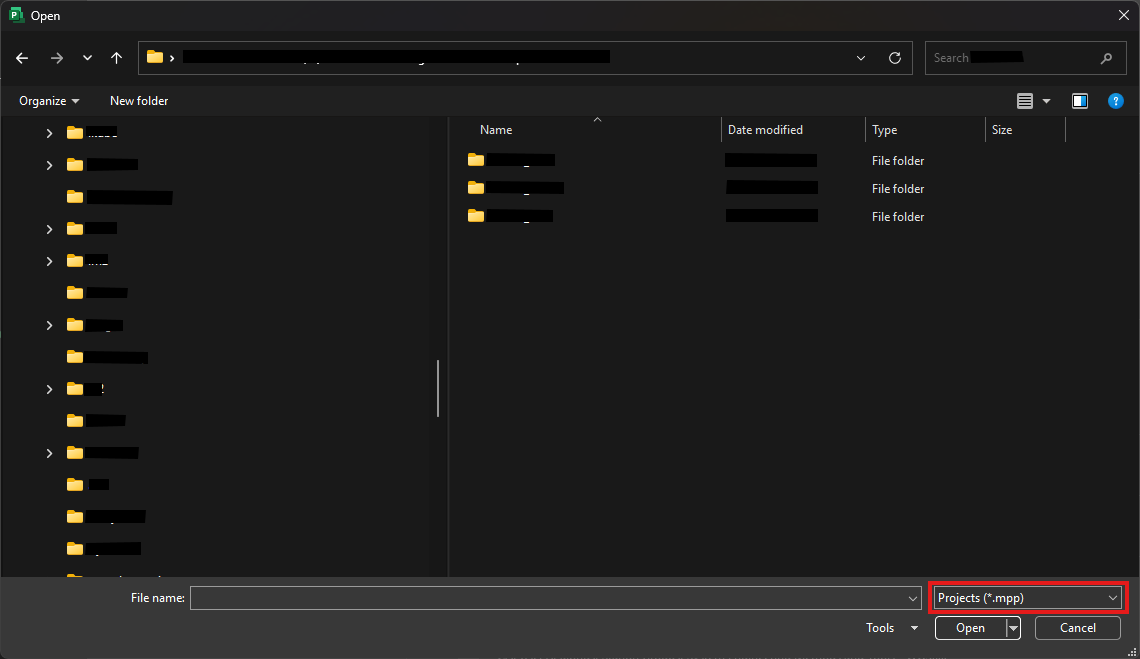
Choose Open → Browse.
-
In the file browser change the format dropdown (highlighted below) to All Files (*.*).
-
Select the downloaded file and follow the import wizard.
-
Microsoft Project will display the Gantt chart. Save the file in
.mppformat to avoid repeating these steps in the future.