Spectral Bands
Table of contents
Overview
Spectral Bands define the wavelength ranges that a Payload (instrument/sensor) operates in. Each band describes a narrow window of the electromagnetic spectrum that the instrument observes. Bands are the link between the physical hardware (Payload) and its scientific capability.
All wavelength values in EORSA-DB are expressed in nanometers (nm).
Band Properties
| Property | Type | Description |
|---|---|---|
| Name | string (required) | Full name of the band (e.g., Band 1 — Blue). |
| Short Name | string (required) | Abbreviated identifier used in charts (e.g., B1, VNIR-1). This label appears on the Y-axis of the Spectrum Coverage view. |
| Definition | text (required) | Free-text description of the band’s purpose and spectral characteristics. |
| Center of Band | double (nm) | Central wavelength of the band in nanometers. |
| Spectral Width | double (nm) | Full width (bandwidth) of the band in nanometers. |
| Data Source | string | Reference to the source document or specification from which the band data was taken. |
| Related Payload | Payload link | The parent Payload that carries this band. Set automatically from context when creating via a Payload’s detail page. |
| Attachments | file list | Attached documents or drawings related to the band. |
| Illustrative Images | image list | Images illustrating the band (e.g., spectral response curves). |
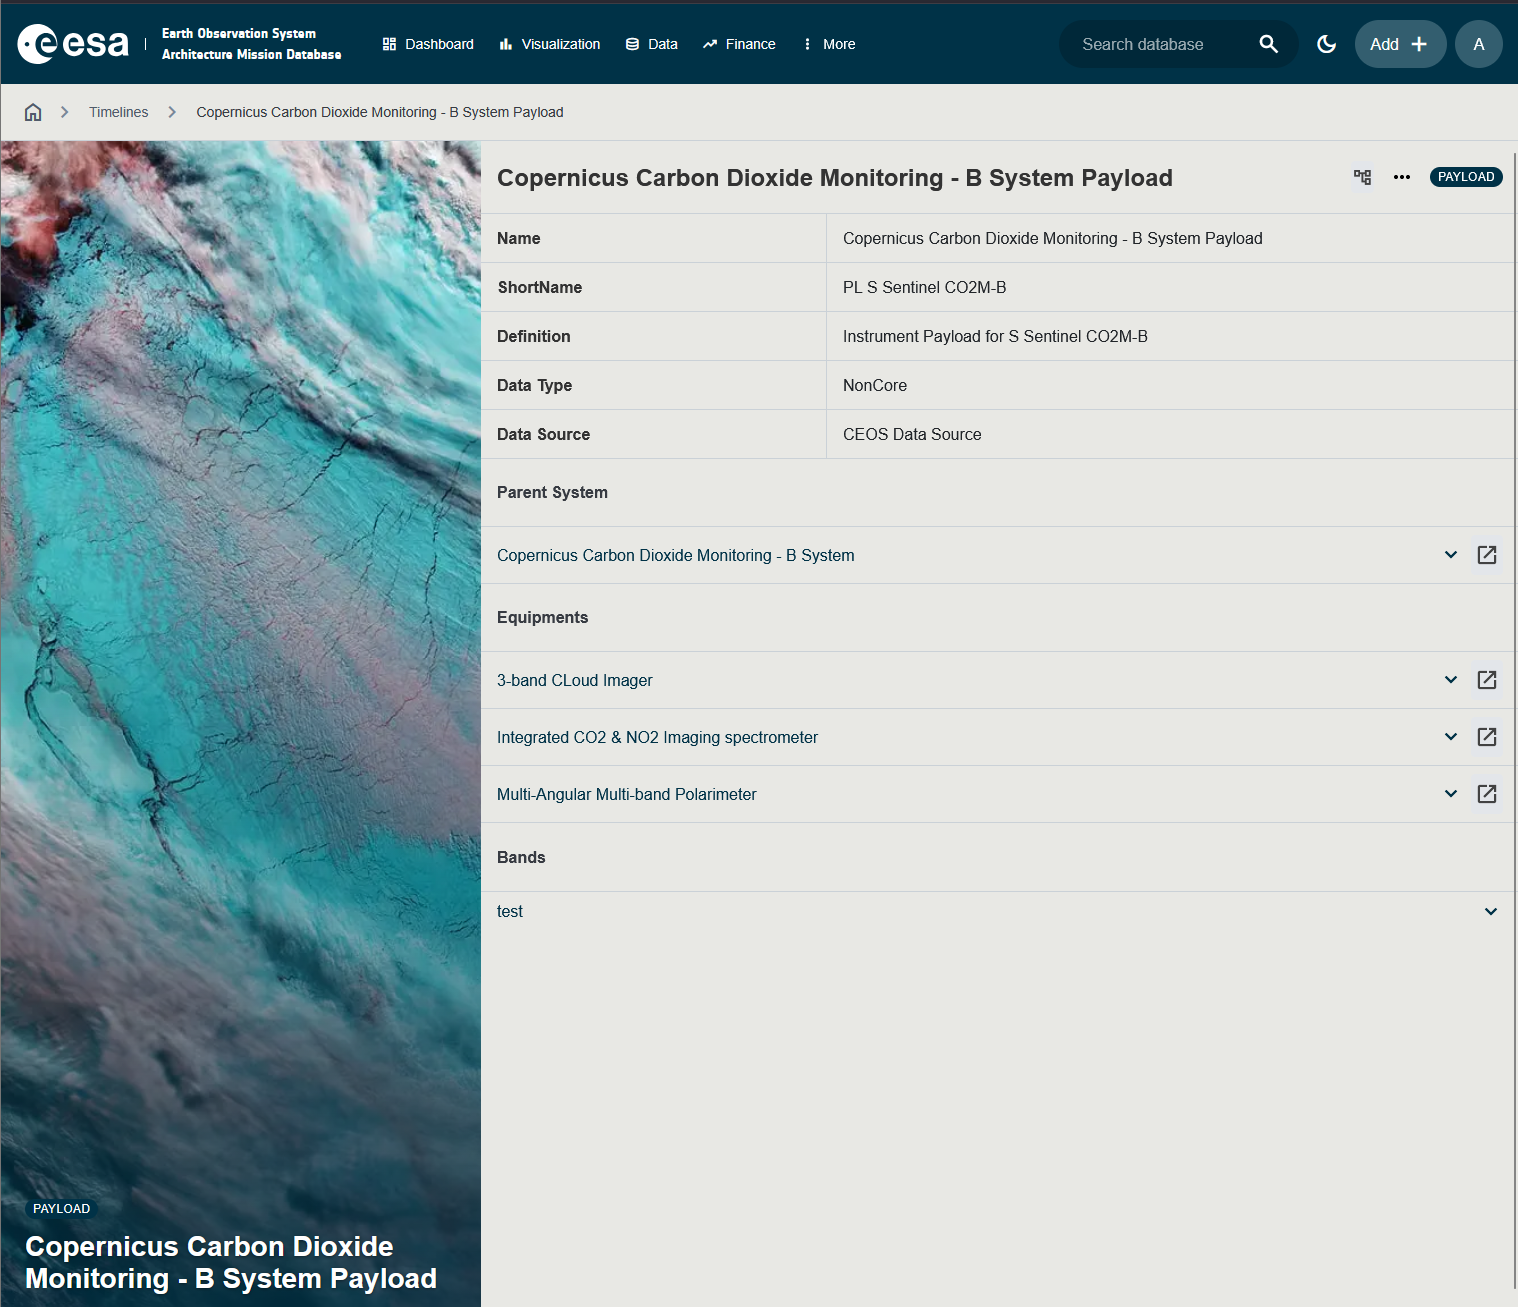
Viewing Bands on a Payload
- Navigate to Data → select System as subject.
- Find the system and click its row to open the detail page.
- Scroll to the Spectral Bands section.
The section lists all bands defined for this payload, showing their Name, Short Name, Center of Band, and Spectral Width.
Adding a Band to a Payload
Adding a band requires the AddCoreData permission.
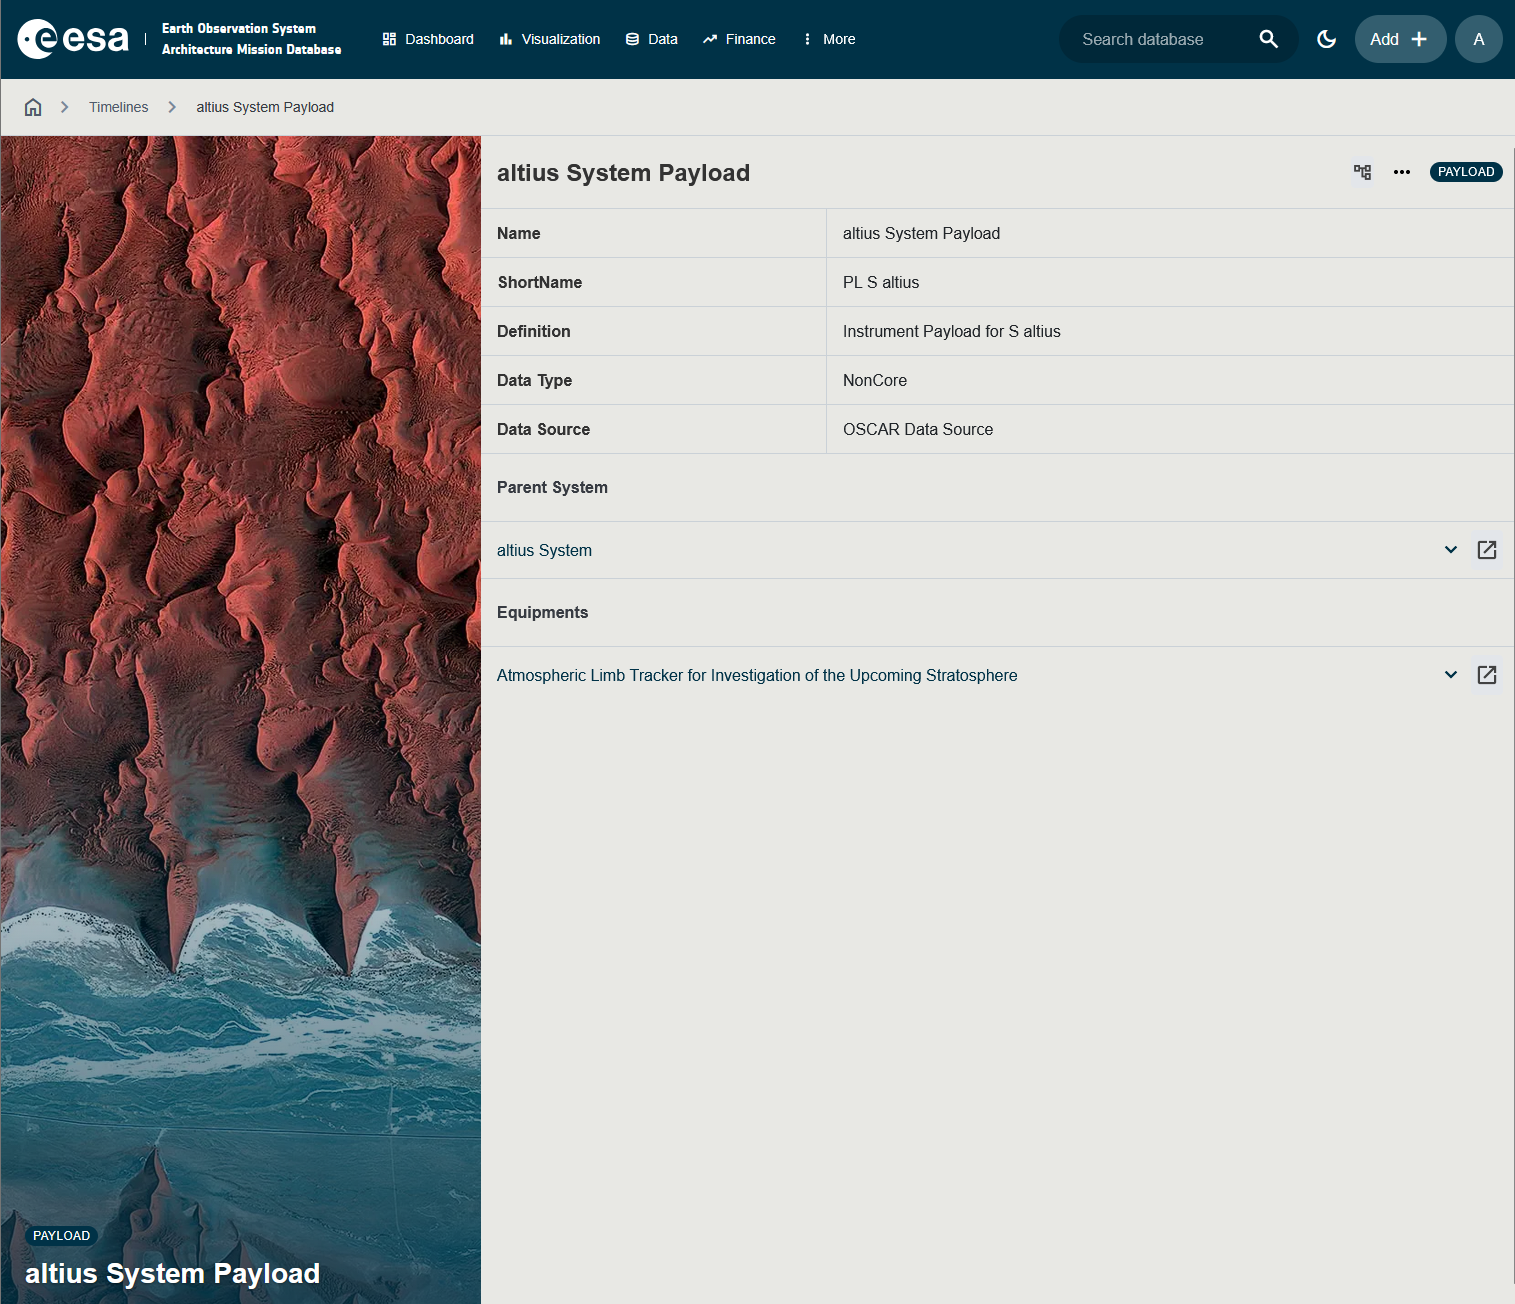
Step 1 — Open the Payload detail page
- Navigate to Data → select System as subject.
- Find the system and click its row to open the detail page.
- Click on the three dots, on the top right of the page, and click Edit.
Step 2 — Open the Add Band form
In the Bands section, click the + Add Band button (or Add button if shown).
The Add Band side panel opens.
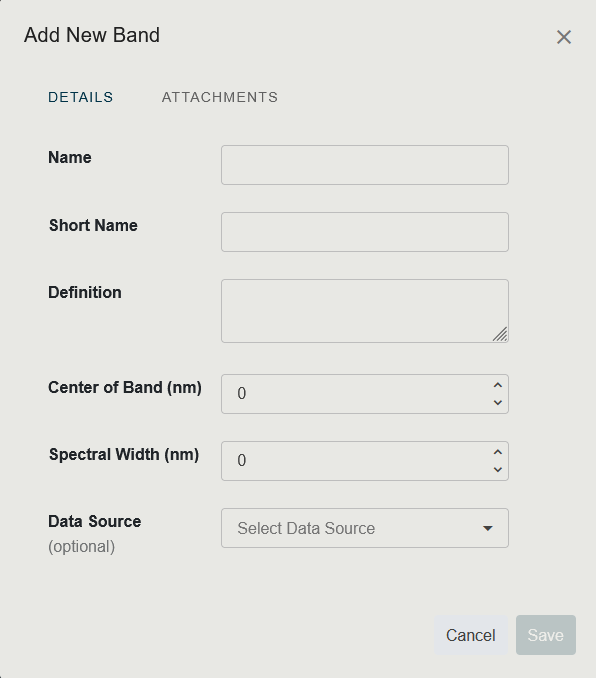
Step 3 — Fill in the form
| Field | Required | Guidance |
|---|---|---|
| Name | Yes | Use a descriptive name (e.g., Band 1 — Blue, Thermal Infrared). |
| Short Name | Yes | Concise identifier used in the Spectrum Coverage chart (e.g., B1, TIR). |
| Definition | Yes | Describe the band’s purpose, what it measures, and any design constraints. |
| Center of Band (nm) | No | Central wavelength in nanometers. Example: 665 for the red Sentinel-2 B4 band. |
| Spectral Width (nm) | No | Full-width bandwidth in nanometers. Example: 30 nm. |
| Data Source | No | From where this data comes from |
| Attachments | No | Upload relevant files (PDFs, spec sheets). |
The Related Payload is automatically set to the current payload — you do not need to fill this in manually when adding through the payload detail page.
Step 4 — Save
Click Save to add the band. It appears in the Spectral Bands table of the parent payload.
Editing or Deleting a Band
To edit a band:
- Open the payload’s detail page.
- In the Spectral Bands table, click the band row.
- The band’s detail / edit panel opens. Modify the fields and click Save.
To delete a band:
- Open the payload’s detail page.
- In the Spectral Bands table, use the Delete action on the band row.
Deleting a band is permanent. It removes the band from the Spectrum Coverage visualisation in the Timelines application.
Visualising Bands in the Timeline Application
All defined spectral bands can be seen plotted on a wavelength axis in the Spectrum Coverage view of the Timelines application:
- Navigate to Timelines.
- In the view toggle bar, click Spectrum Coverage.
- Use the payload filter to select which payloads to include.
- Each band is drawn as a horizontal bar centred on its Center of Band wavelength, with a width matching the Spectral Width.
See Timelines Application for more details.
Permissions Summary
| Action | Required Permission |
|---|---|
| View bands | AccessOtherDataButProgrammatics |
| Add a band | AddCoreData |
| Edit a band | ModifyCoreData |
| Delete a band | ModifyCoreData |