Financial Application
Table of contents
Overview
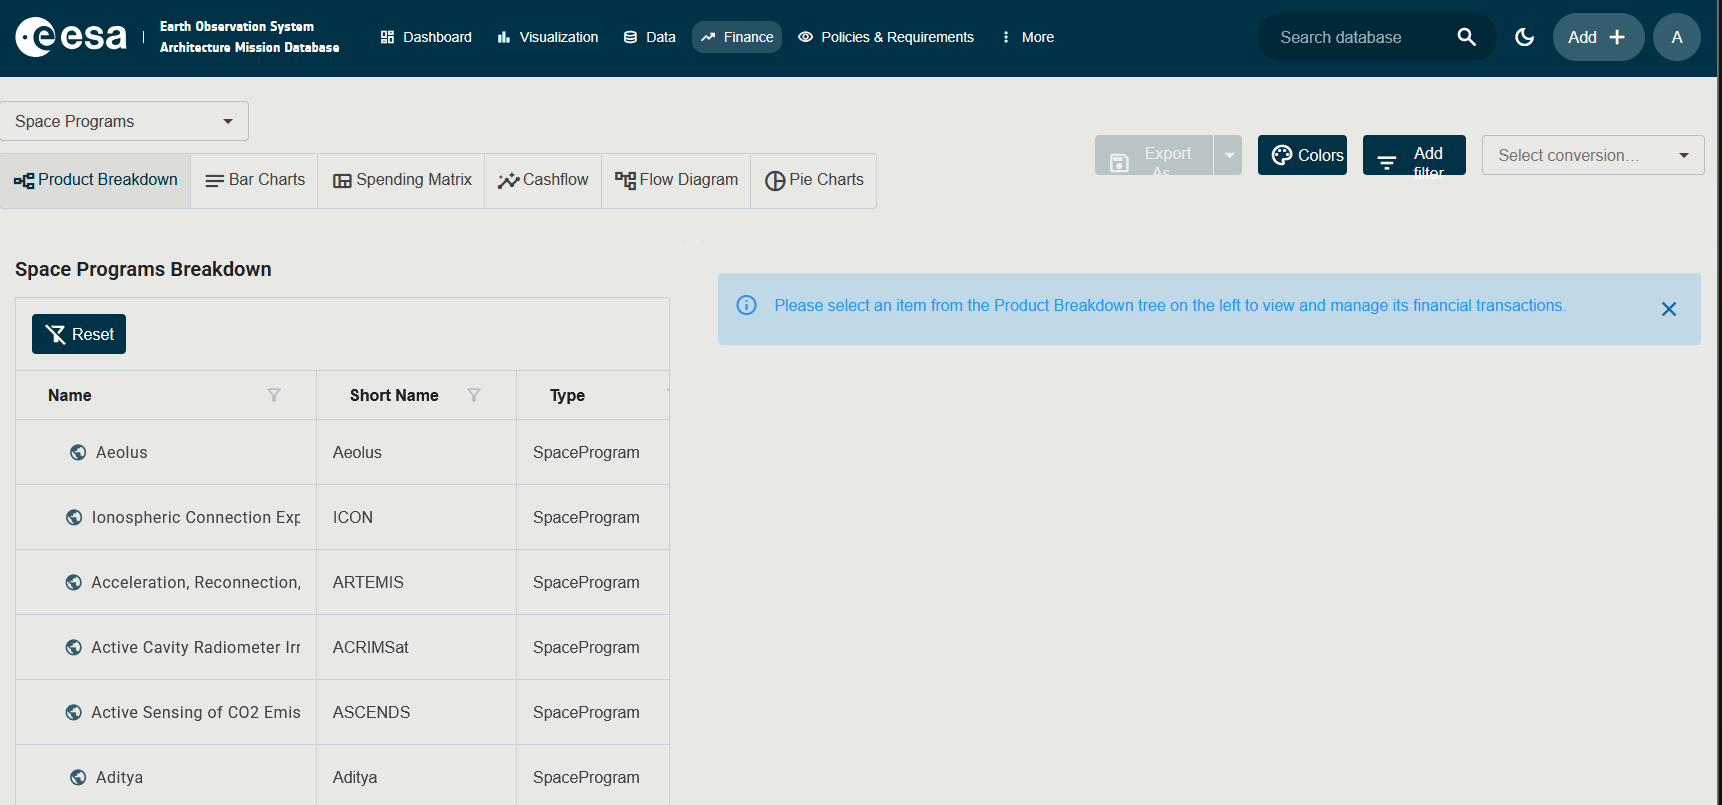
The Financial application provides access to the programmatic and financial data of Earth Observation missions and projects. It is accessible from the Finance menu item in the top navigation bar.
Access to the Financial application requires the AccessProgrammaticData permission. This is a restricted permission not granted to standard read-only users.
Toolbar
The toolbar at the top of the page contains two groups of controls:
Left Controls
| Control | Description |
|---|---|
| Subject dropdown | Selects the mission or project programme to display financial data for. |
| View toggle | Switches between the available financial views (see Views below). |
Right Controls
| Control | Description |
|---|---|
| Filter badges | Active advanced filters are shown as removable chips. |
| Export As… | Exports the current view to the supported format. The split-button remembers the last format used. Disabled when no export option is available for the current view. |
| Colors | (Where available) Opens the Colors dialog to customise colour mapping. Only shown in views that support colour coding. |
| Add filter | Opens the Filter Panel to build advanced filters (property, operator, value) combined with AND / OR. |
| Select conversion year | Dropdown to select an Economic Condition (conversion year) for currency normalisation. Leave empty to use nominal values. |
Views
The view toggle bar provides up to six different views of the financial data. Select a subject first — the toggle bar is always visible but some views may show no data if the subject has no financial entries.
| View | Icon | Description |
|---|---|---|
| Product Breakdown | flowchart | A tree structure showing the mission’s cost broken down by product / sub-system hierarchy. A detail pane on the right shows the selected node’s financial figures. |
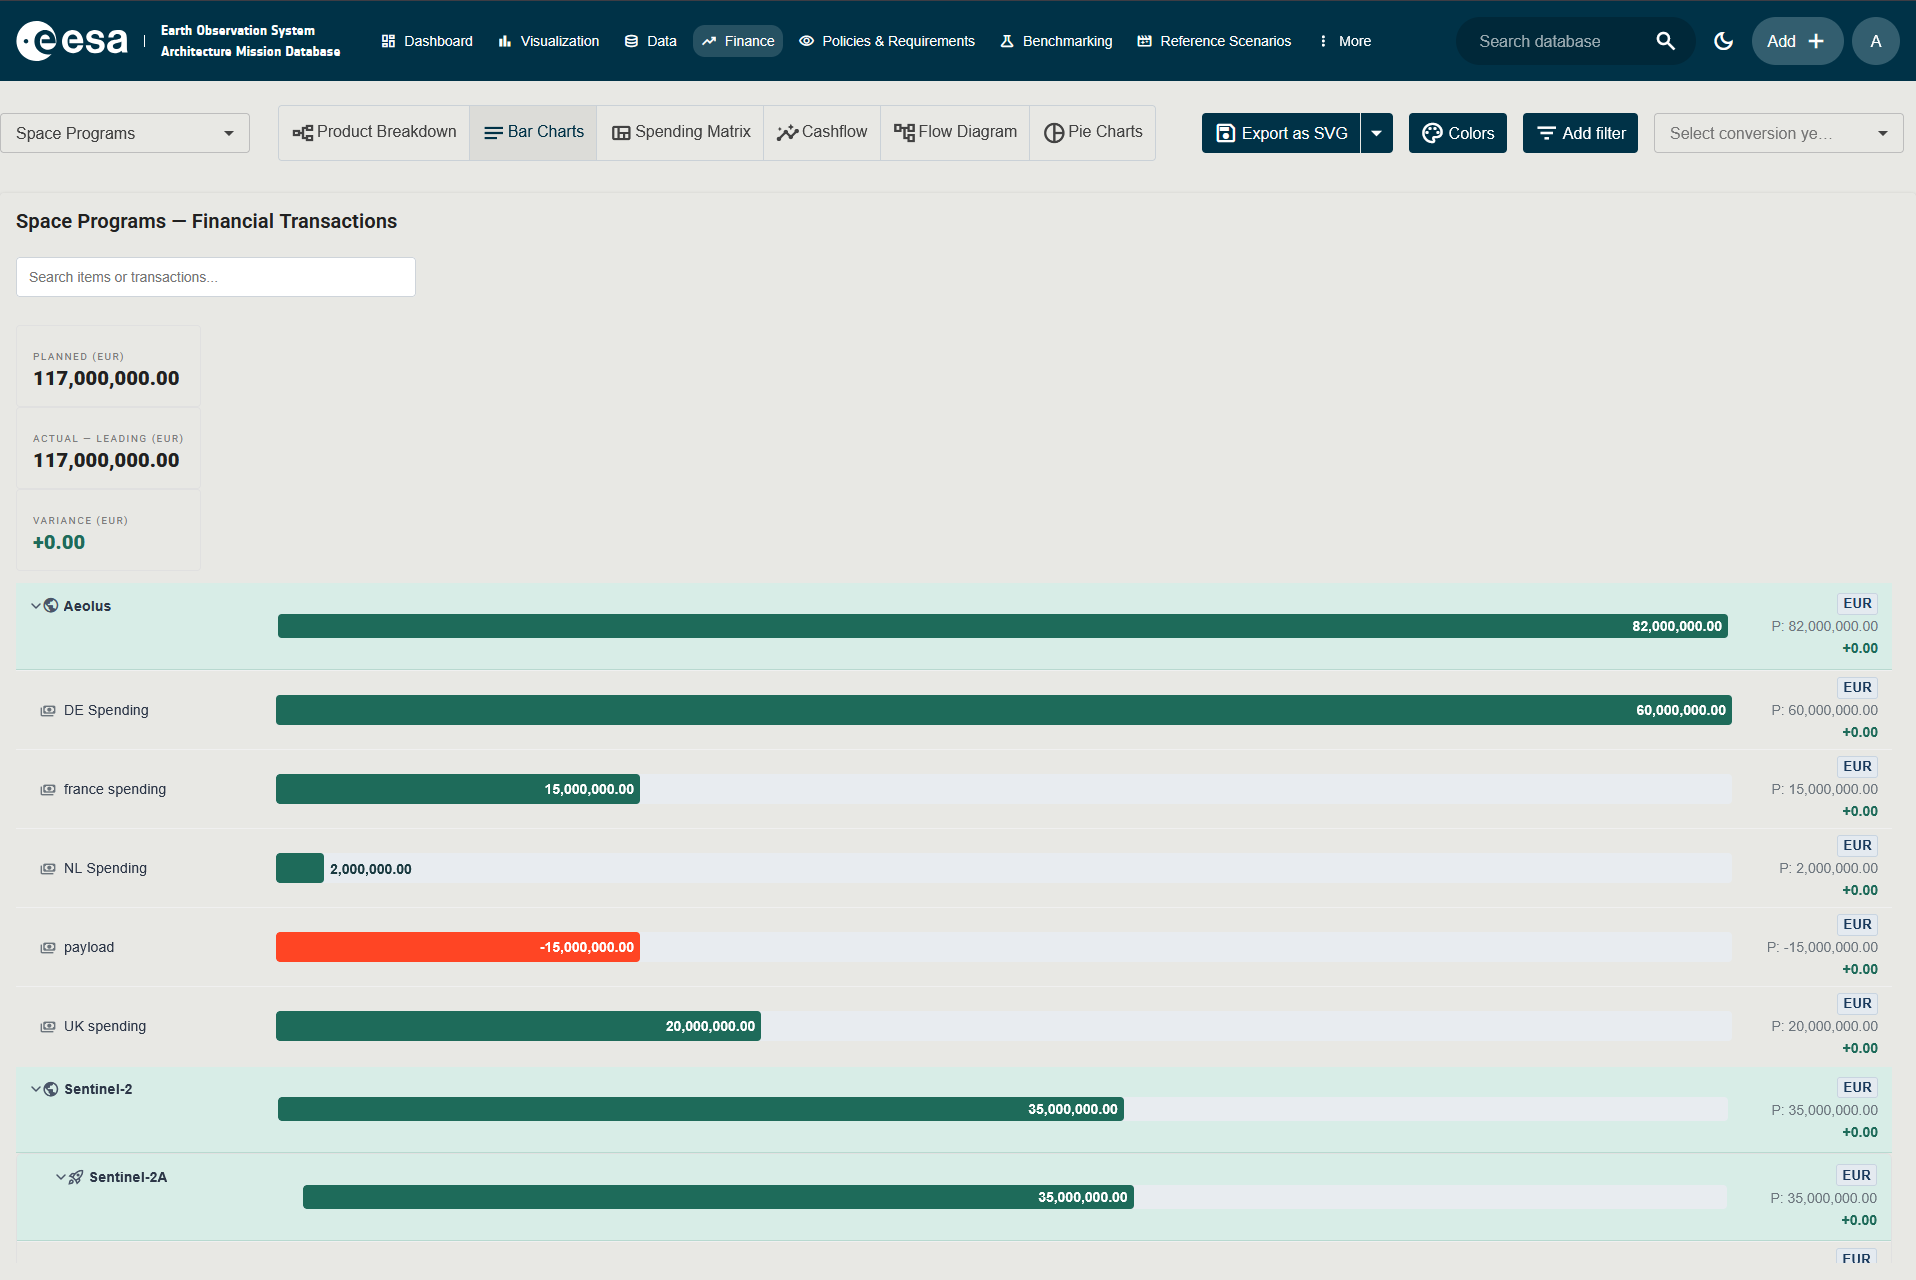
| Bar Charts | notes | Stacked or grouped bar charts comparing financial values across phases or sub-systems. |
| Spending Matrix | view_quilt | A matrix (grid) view showing spending across multiple dimensions (e.g., phase × category). |
| Cashflow | insights | A time-series line or area chart showing cumulative and annual cashflow over the mission lifetime. |
| Flow Diagram | account_tree | A Sankey-style flow diagram tracing the financial flow between parties / phases. |
| Pie Charts | pie_chart | Pie charts breaking down costs by category, phase, or contractor. |
Adding a Financial Transaction
Financial transactions are the individual cost/income records attached to any element in the mission hierarchy (Space Program, Mission, Segment, System, Element…). The process below adds a transaction via the Product Breakdown view.
Step 1 — Open the Product Breakdown view
- Navigate to the Financial page.
- Select a Subject (a mission or programme) from the subject dropdown.
- In the view toggle bar, click Product Breakdown (flowchart icon).
The left pane displays the cost hierarchy tree. The right pane shows detail for the selected node.
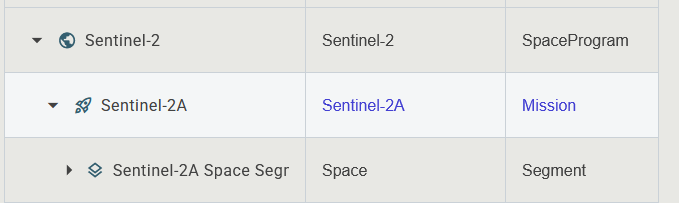
Step 2 — Select the node to attach the transaction to
Click on any node in the left-side tree — Mission, Segment, System, Element, or Sub-System. The right pane updates to show that item’s current financial transactions in a grid.
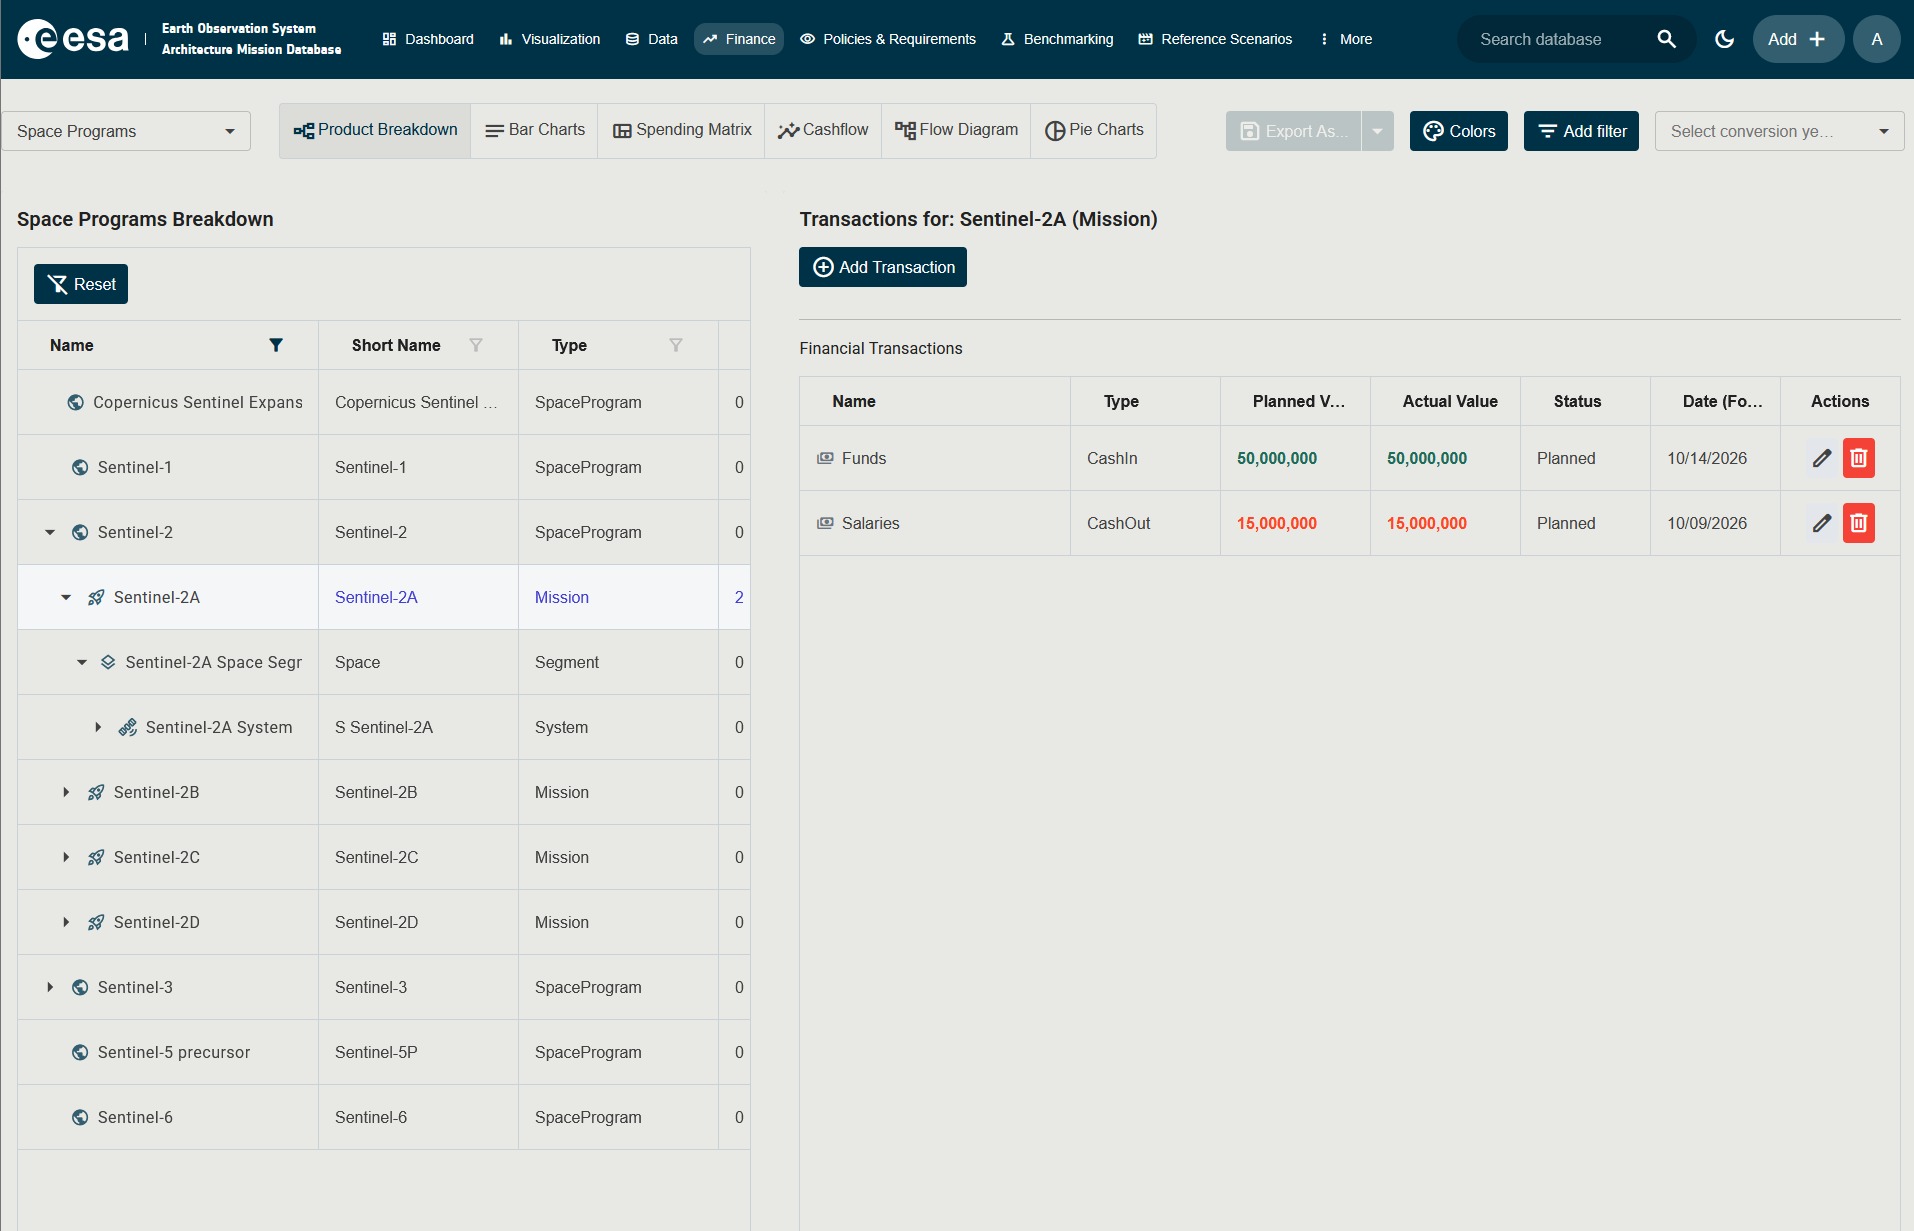
Step 3 — Click “Add Transaction”
In the right pane, click the Add Transaction button (shown above the transactions grid).
The Edit Financial Transaction side panel opens.
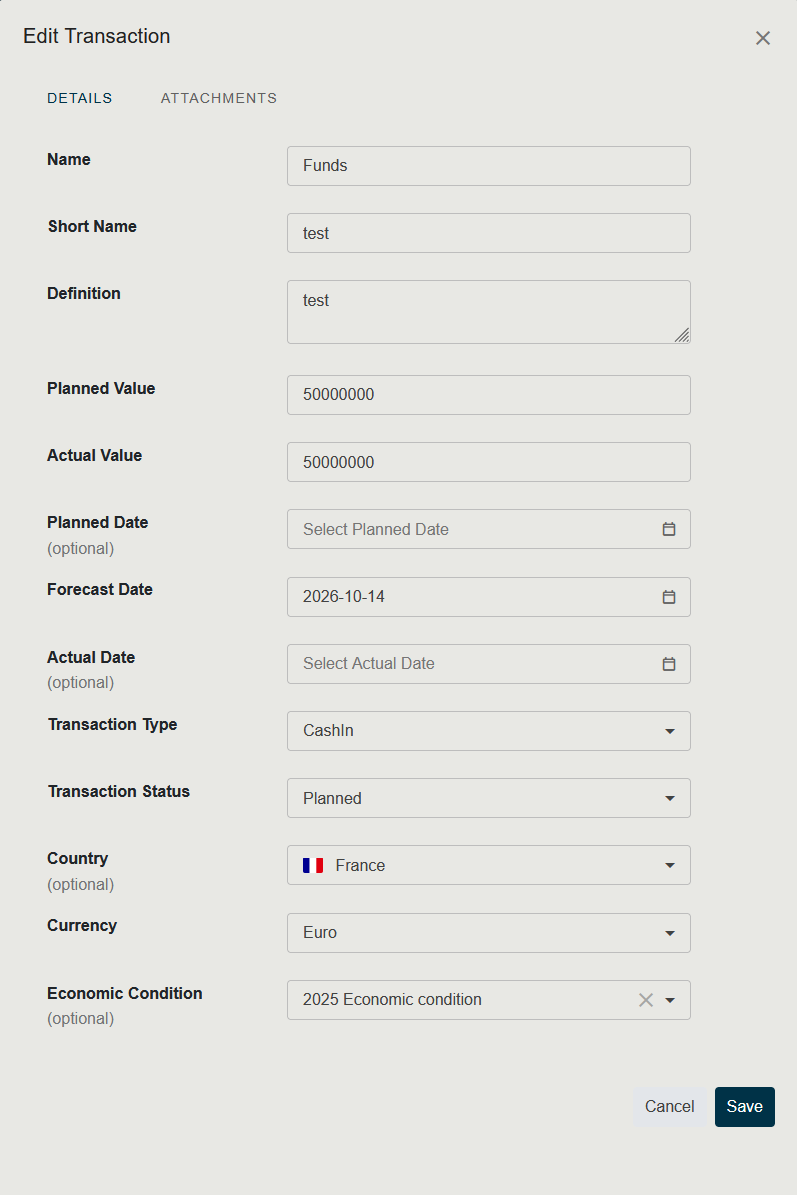
Step 4 — Fill in the form
| Field | Required | Description |
|---|---|---|
| Name | Yes | Full name of the transaction (e.g., “Phase B Development Contract”). |
| Short Name | Yes | Abbreviated name. |
| Definition | Yes | Free-text description of what the transaction represents. |
| Planned Value | No | The budgeted/expected value as a string (e.g., 1000000). No currency symbol needed here — set the currency below. |
| Actual Value | No | The actual realised value. Leave empty while still forecasted. |
| Planned Date | No | The originally planned date for this transaction. |
| Forecast Date | Yes | The current best estimate of when the transaction occurs. |
| Actual Date | No | The date on which the transaction was realised. |
| Transaction Type | Yes | Cash In (income) or Cash Out (expenditure). |
| Transaction Status | Yes | Planned or Actual. |
| Country | No | Country of origin of the transaction (selected from a flag dropdown). |
| Currency | No | Currency unit (e.g., EUR, USD) for the recorded values. Managed in Administration → Currencies. |
| Reference Economic Condition | No | Links the transaction to a specific economic reference year, allowing normalised comparison. See Economic Conditions. |
| Related Things | No | Optional links to other model elements that this transaction relates to. |
| Data Source | No | Reference source (document, URL, contract number) for this transaction. |
Step 5 — Save
Click Save to record the transaction. It appears in the transactions grid of the selected node, colour-coded:
- Green —
Cash Intransactions - Red —
Cash Outtransactions
The columns in the transactions grid are: Name, Type, Planned Value, Actual Value, Status, Date (Forecasted).
To edit an existing transaction, click on its row in the grid. To delete, use the delete action on the row.
Currency Conversion
The Select conversion year dropdown (top right) lets you apply an Economic Condition to normalise all financial figures to a common reference year. This allows meaningful comparisons between missions whose costs were recorded in different years with different inflation factors.
- Select a conversion year to display adjusted (real) values.
- Leave the field empty to display nominal values as recorded.
Economic Conditions are managed in the Administration application (requires AccessProgrammaticData).
Quick Filters Panel
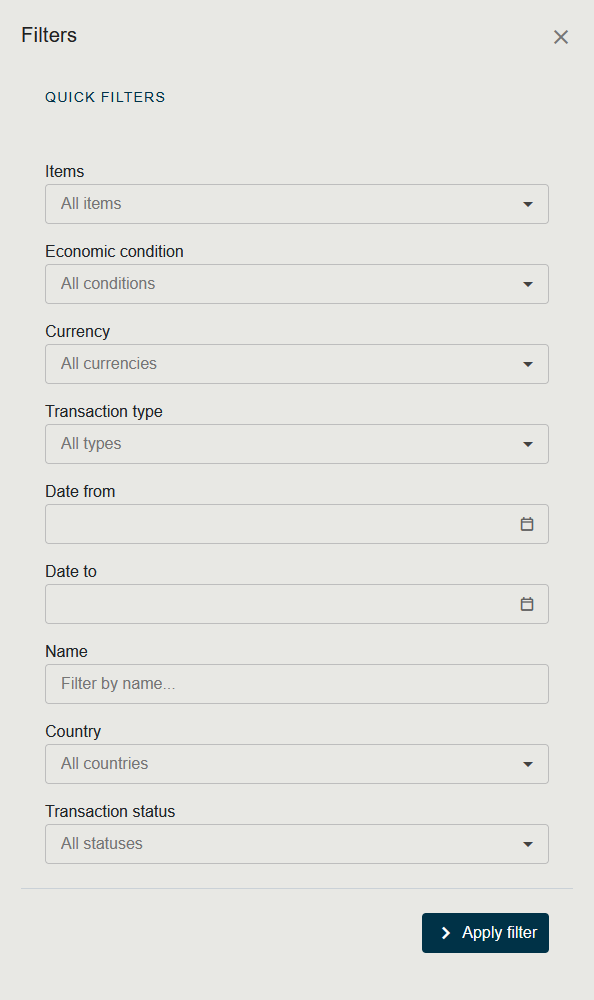
When you click Add filter the Filter Panel opens on the right. The panel groups the most common filters in a fixed list of fields rather than the generic property/operator/value builder used elsewhere in the app. Each field is optional; leaving it empty includes everything.
| Field | Description |
|---|---|
| Items | Multi-select of the items (Missions, Programmes, Systems, …) to include. Each item shows its type icon. |
| Economic condition | Single-select of an Economic Condition. |
| Currency | Single-select of a Currency code. |
| Transaction type | Cash In or Cash Out. |
| Date from / Date to | Date pickers limiting the time range. |
| Name | Free-text filter on the transaction name. |
| Country | Multi-select of country codes, each shown with its flag. |
| Transaction status | Planned or Actual. |
Applied filters appear as removable chips in the toolbar so you can see at a glance what is active.

Customising Colours
Several views support colour customisation through dedicated dialogs.
- Open the view you want to recolour (for example Pie Charts or Flow Diagram).
- Click the Colors button in the right-hand toolbar group. The matching dialog opens:
- For the Flow Diagram the dialog is In/Out Flow Colors, where you can pick the colour used for incoming flows and the colour used for outgoing flows.
- For the Pie Charts the dialog is Pie Chart Colors, where you can override the colour assigned to each category slice.
- Pick the colours you want and click Save. The view redraws using your selection.
- To revert to the defaults, reopen the dialog and click the reset action (where shown), or close the dialog with Cancel to discard pending changes.
Your colour choices are remembered for future sessions on the same browser.
Permissions Summary
| Action | Required Permission |
|---|---|
| View the Financial page | AccessProgrammaticData |
| Export financial data | AccessProgrammaticData |
| Manage Currencies / Economic Conditions | AccessProgrammaticData (via Administration) |